Traces
Traces provides comprehensive monitoring of all agent and chat interactions on the Galene.AI Platform. Super administrators can browse conversations, analyze agent performance, and monitor Generative Shield activity.
Traces is exclusively available to super administrators. Every time you access a trace, the system automatically creates an audit log entry recording your User ID, timestamp, IP address, and browser information. Only access traces when you have legitimate business justification.
What are Traces?
Traces are comprehensive records of conversations between users and AI agents. Each trace captures the complete conversation thread, agent processing steps, Generative Shield activity, token usage, performance metrics, and user context.
Purpose: Monitor and optimize agent interactions while ensuring quality and compliance with AI Act requirements (Articles 12, 13, 14, 19).
Access Control: Traces contain personal data protected by GDPR. Access is only permitted for legitimate purposes:
- Investigating policy violations or user complaints
- Security incident investigations
- Compliance audits and troubleshooting
Clicking a Trace ID shows a confirmation dialog ("Are you sure? This access will be logged") and automatically records your access in the Audit system with your User ID, timestamp, IP address, and browser information.
Browsing Traces
Access the Traces dashboard from Observability → Traces in the super admin panel.
Daily Active Users
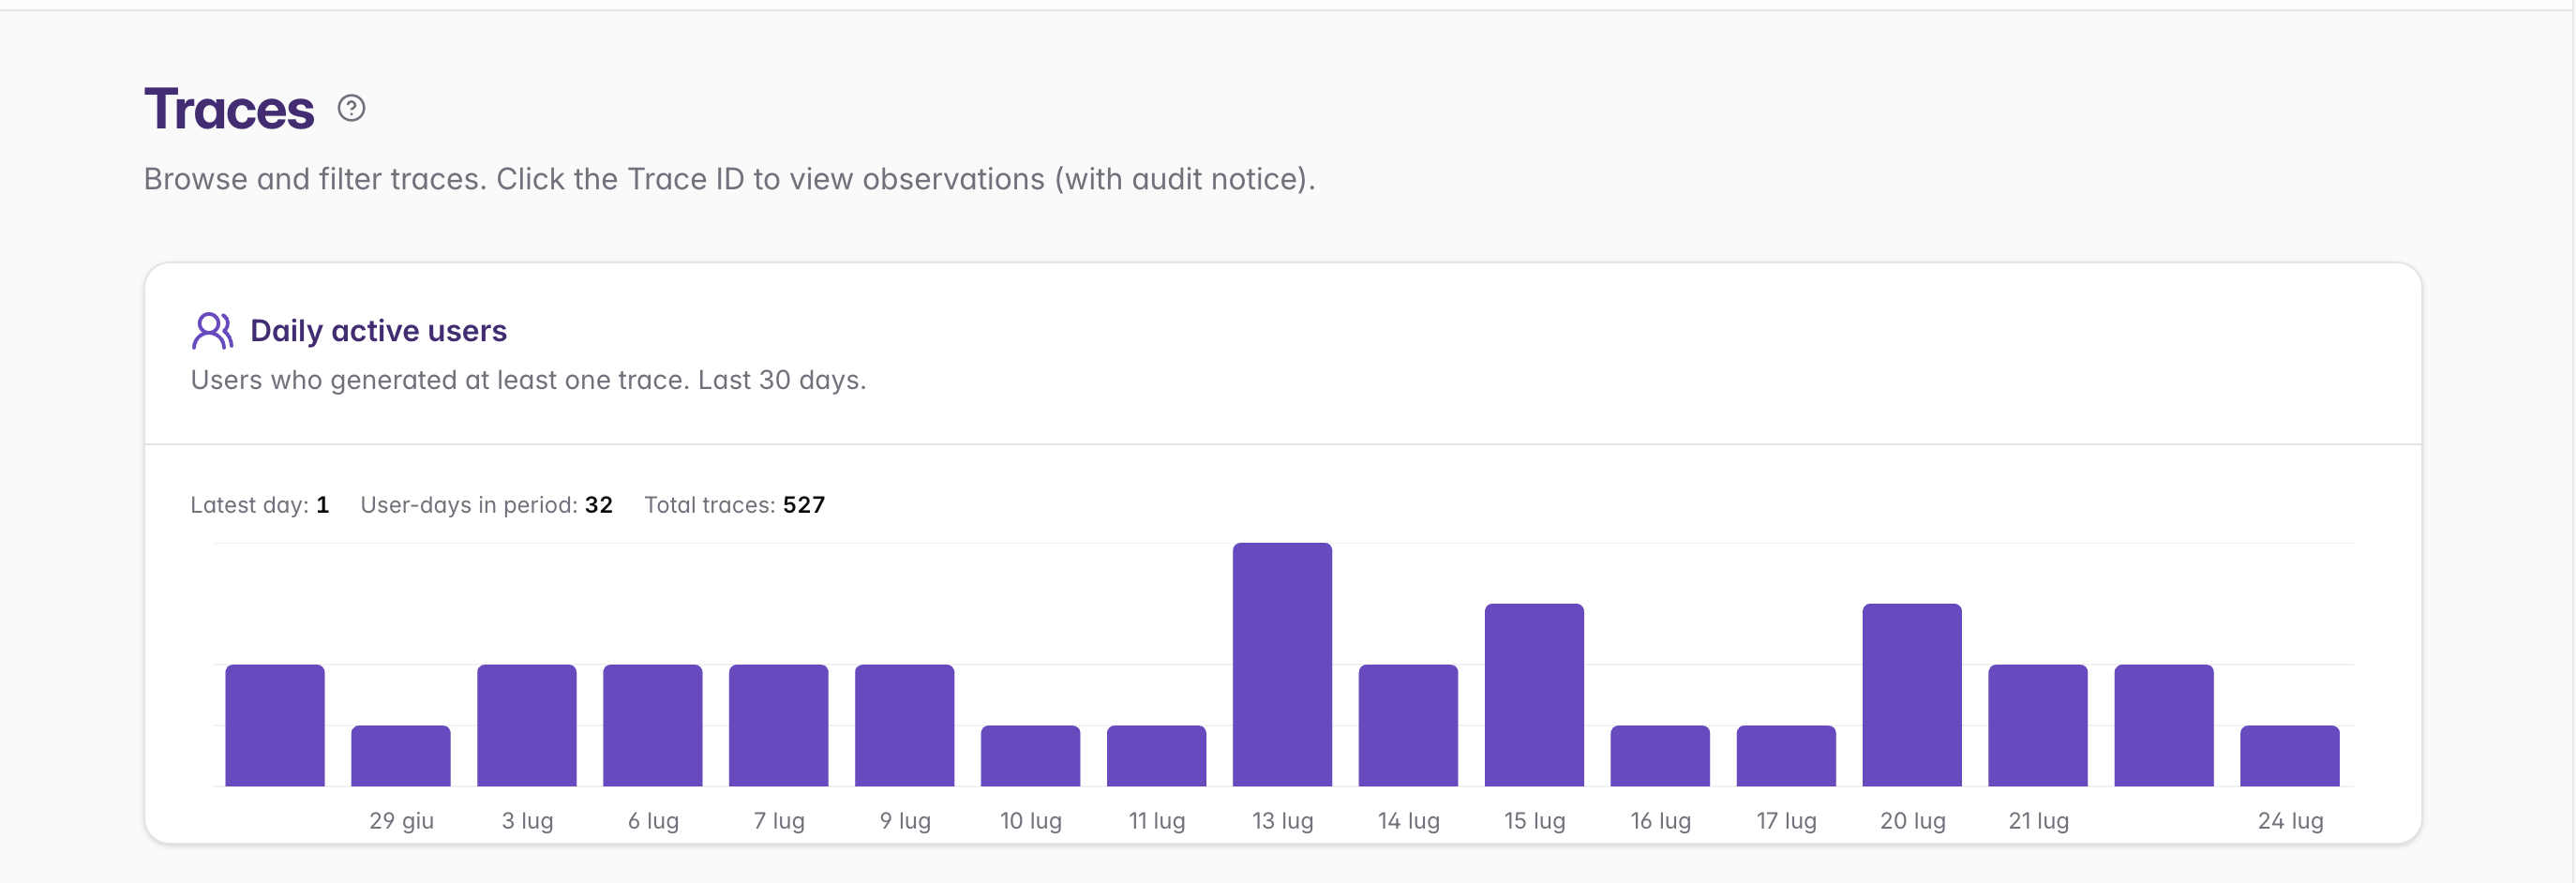
The Daily Active Users chart shows how many distinct users generated at least one trace each day over the last 30 days. Hover a bar for the exact count. The header also displays the latest day count, the total user-days in the period, and the total number of traces.
Trace List
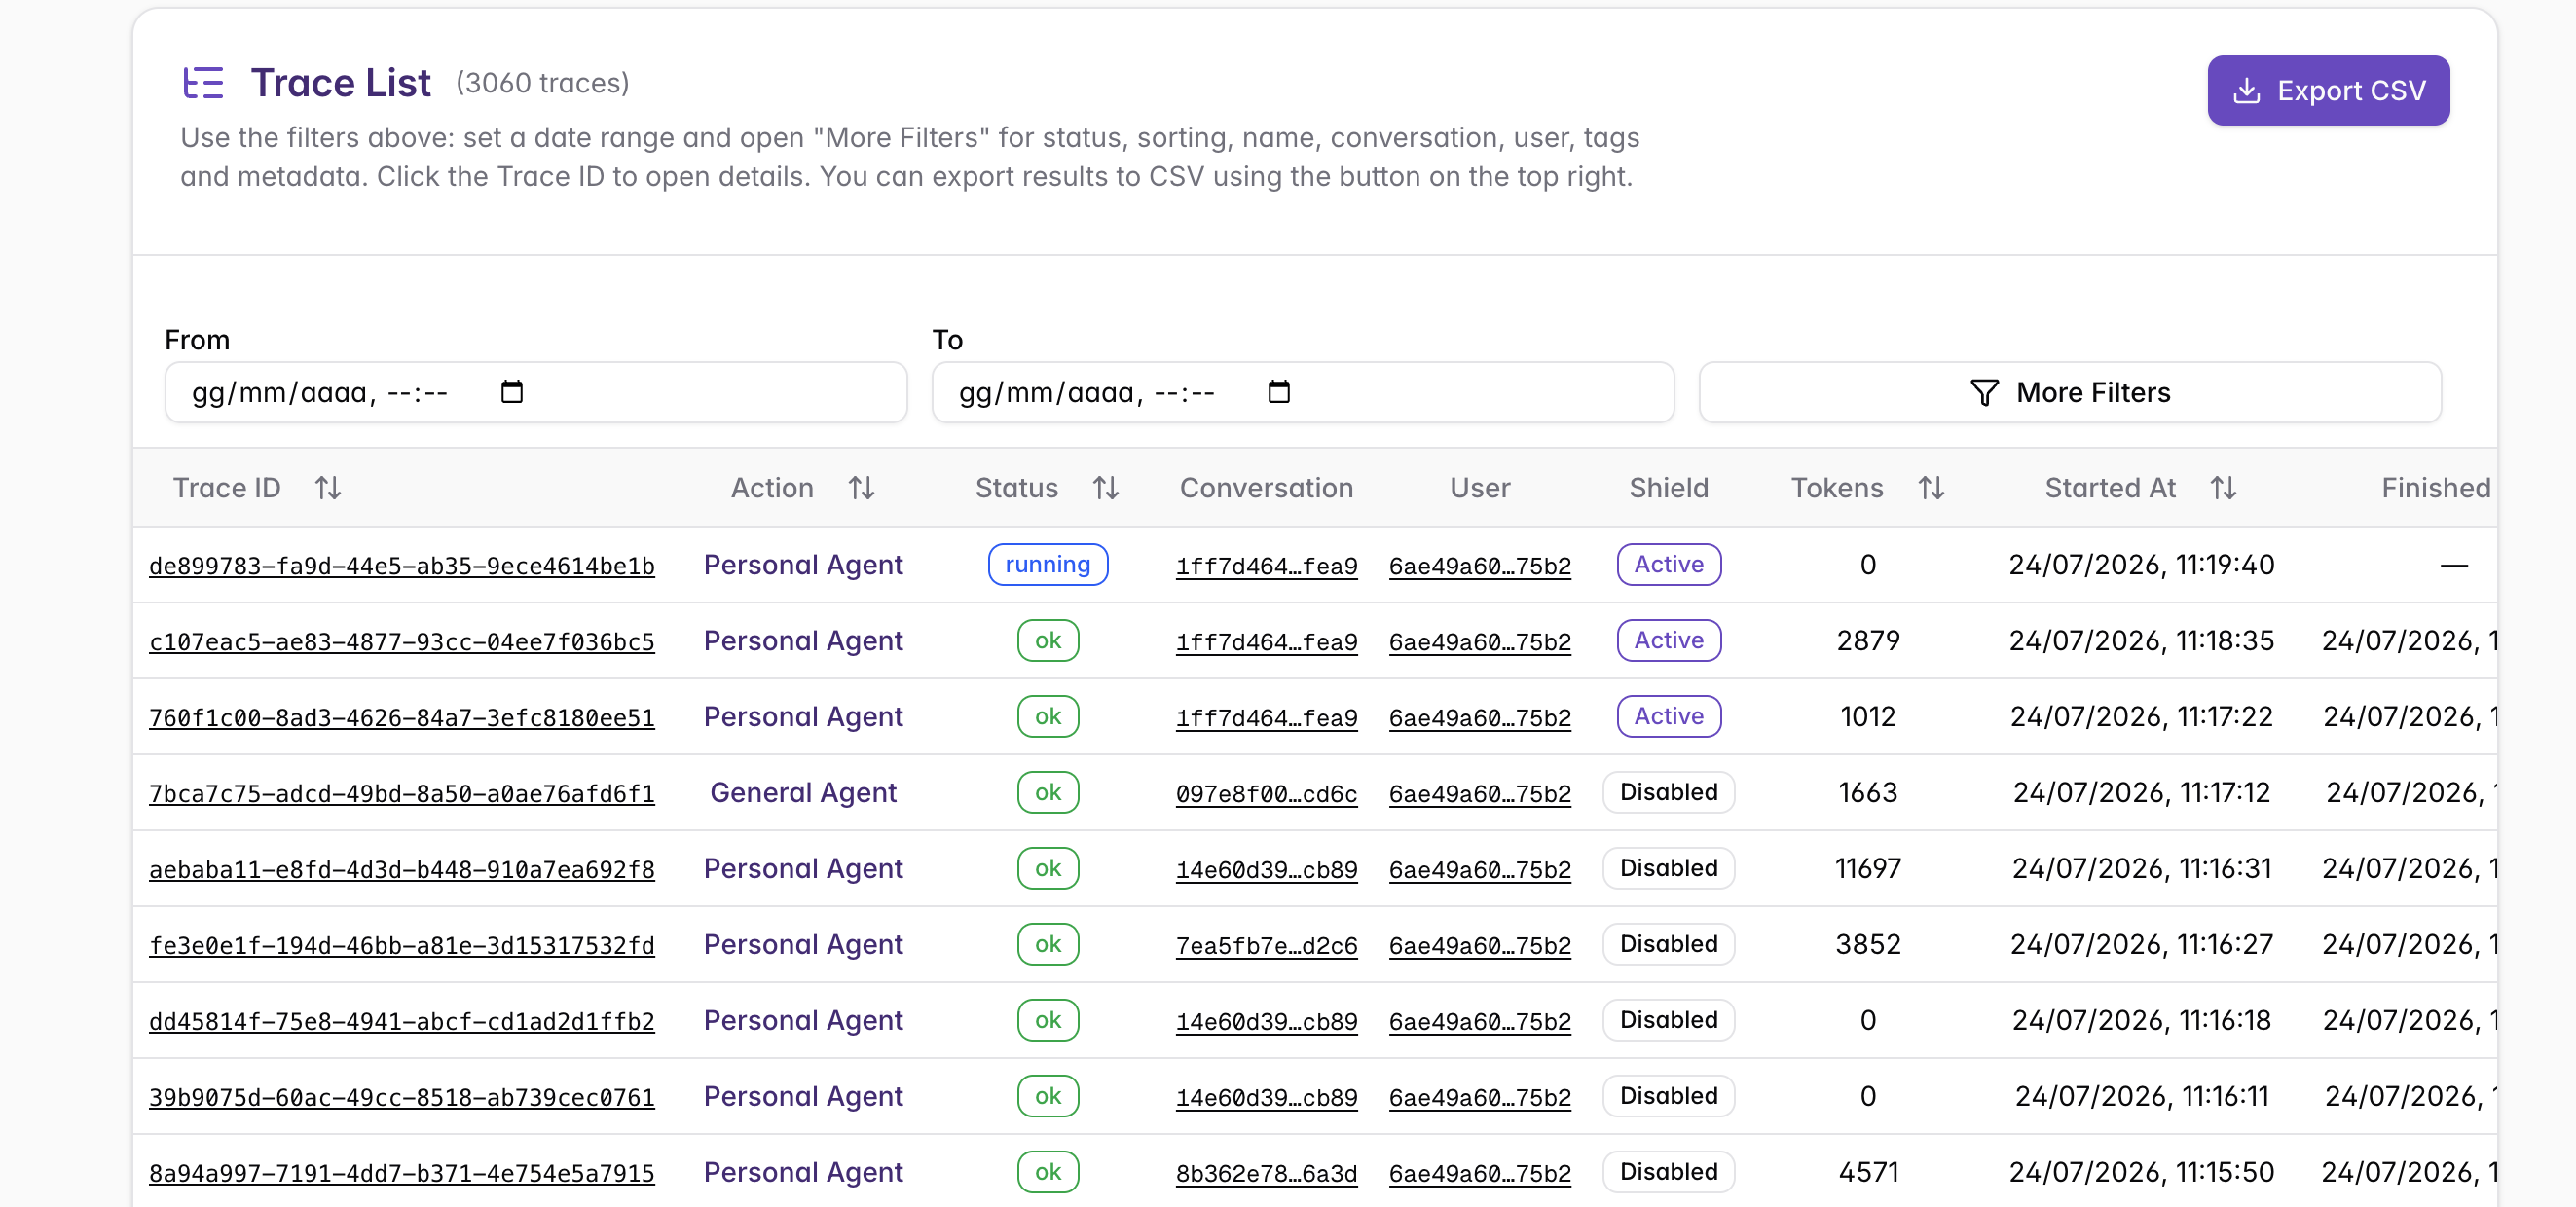
The trace list displays all conversation traces in a searchable table. Use the date range filters and "More Filters" button to narrow results, and click "Export CSV" to download filtered data.
Filtering Traces
Date Range Filtering
Use the From and To date pickers to filter by time range. Specify both date and time for precise filtering.
Advanced Filtering
Click "More Filters" to access additional search options:
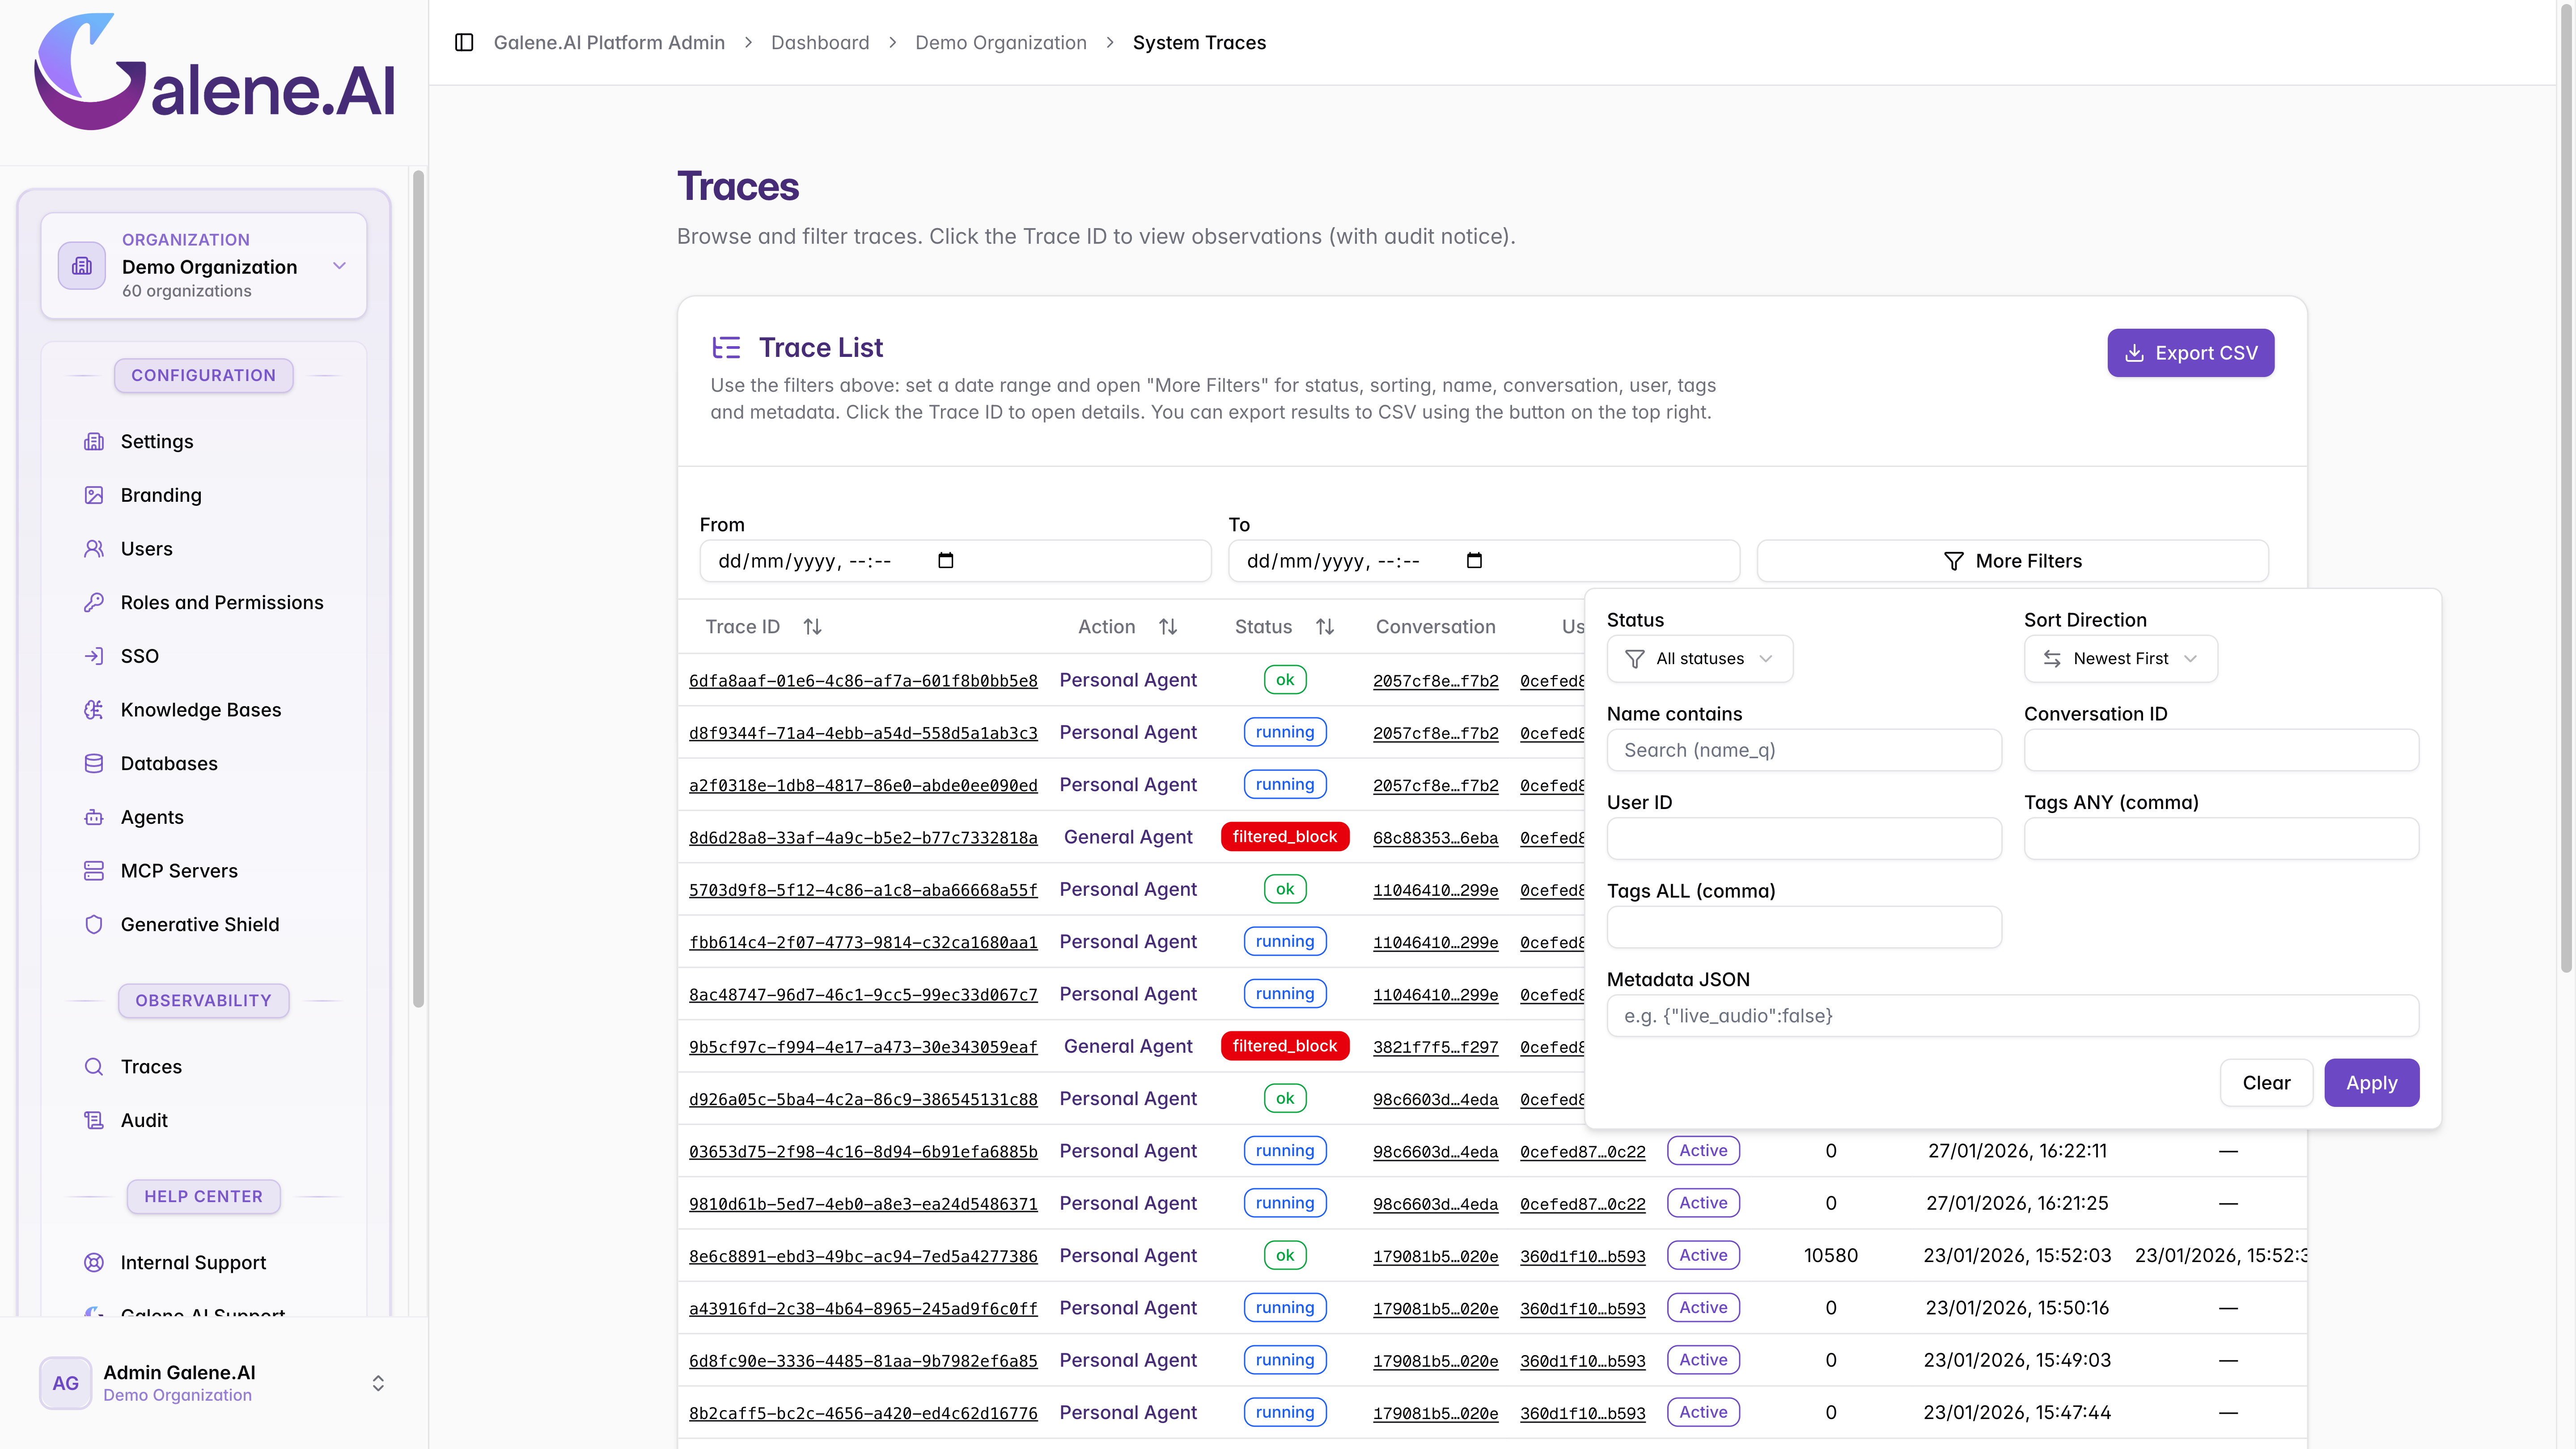
Available Filters:
- Status: Filter traces by Status
- Sort Direction: Sort from newest to oldest trace or viceversa
- Name contains: Search by trace name
- Conversation ID: Filter by specific conversation
- User ID: Filter by specific user
- Tags: Search by tags (comma-separated for multiple)
- Metadata JSON: Filter using custom JSON metadata queries
Apply filters with the Apply button, or click Clear to reset all filters.
Understanding the Trace Table
Each row in the trace table represents one conversation. Key columns include:
- Trace ID: Unique identifier - click to view full details
- Action: Agent type (Personal Agent or General Agent, where General Agent refers to Galene.AI Chat)
- Status: Conversation status with possible values:
- ok: Conversation is idle with no issues detected (not currently generating, but may resume)
- error: An error was encountered during conversation processing
- cancelled: User manually stopped the generation mid-process
- running: Model is actively generating a response
- queued: Conversation request is waiting in the processing queue
- filtered_block: Generative Shield triggered while configured in "Block" mode
- filtered_warn: Generative Shield triggered while configured in "Detect" mode
- Conversation: Conversation UUID
- User: User UUID who had the conversation
- Shield: Generative Shield conversation monitoring status:
- Active: Generative Shield is monitoring but no filters have been triggered
- Warn: Filter triggered while Generative Shield was set to "detect"
- Block: Filter triggered while Generative Shield was set to "block"
- Disabled: Generative Shield was disabled during the conversation
- Tokens: Total token count for the conversation
- Started At / Finished At: Timestamps for conversation duration
- Vision: Whether the model analyzed any image or page layout for the responses
- Reasoning: Model type used (Instant vs Reasoning model)
- Web: Whether web search was used in the conversation
- RAG: Whether Retrieval-Augmented Generation was used in the conversation
Viewing Trace Details
Clicking a Trace ID shows a confirmation dialog: "Are you sure you want to access this trace? This access will be logged in the Audit system." Confirming creates an automatic audit log entry with your User ID, timestamp, IP, and browser.
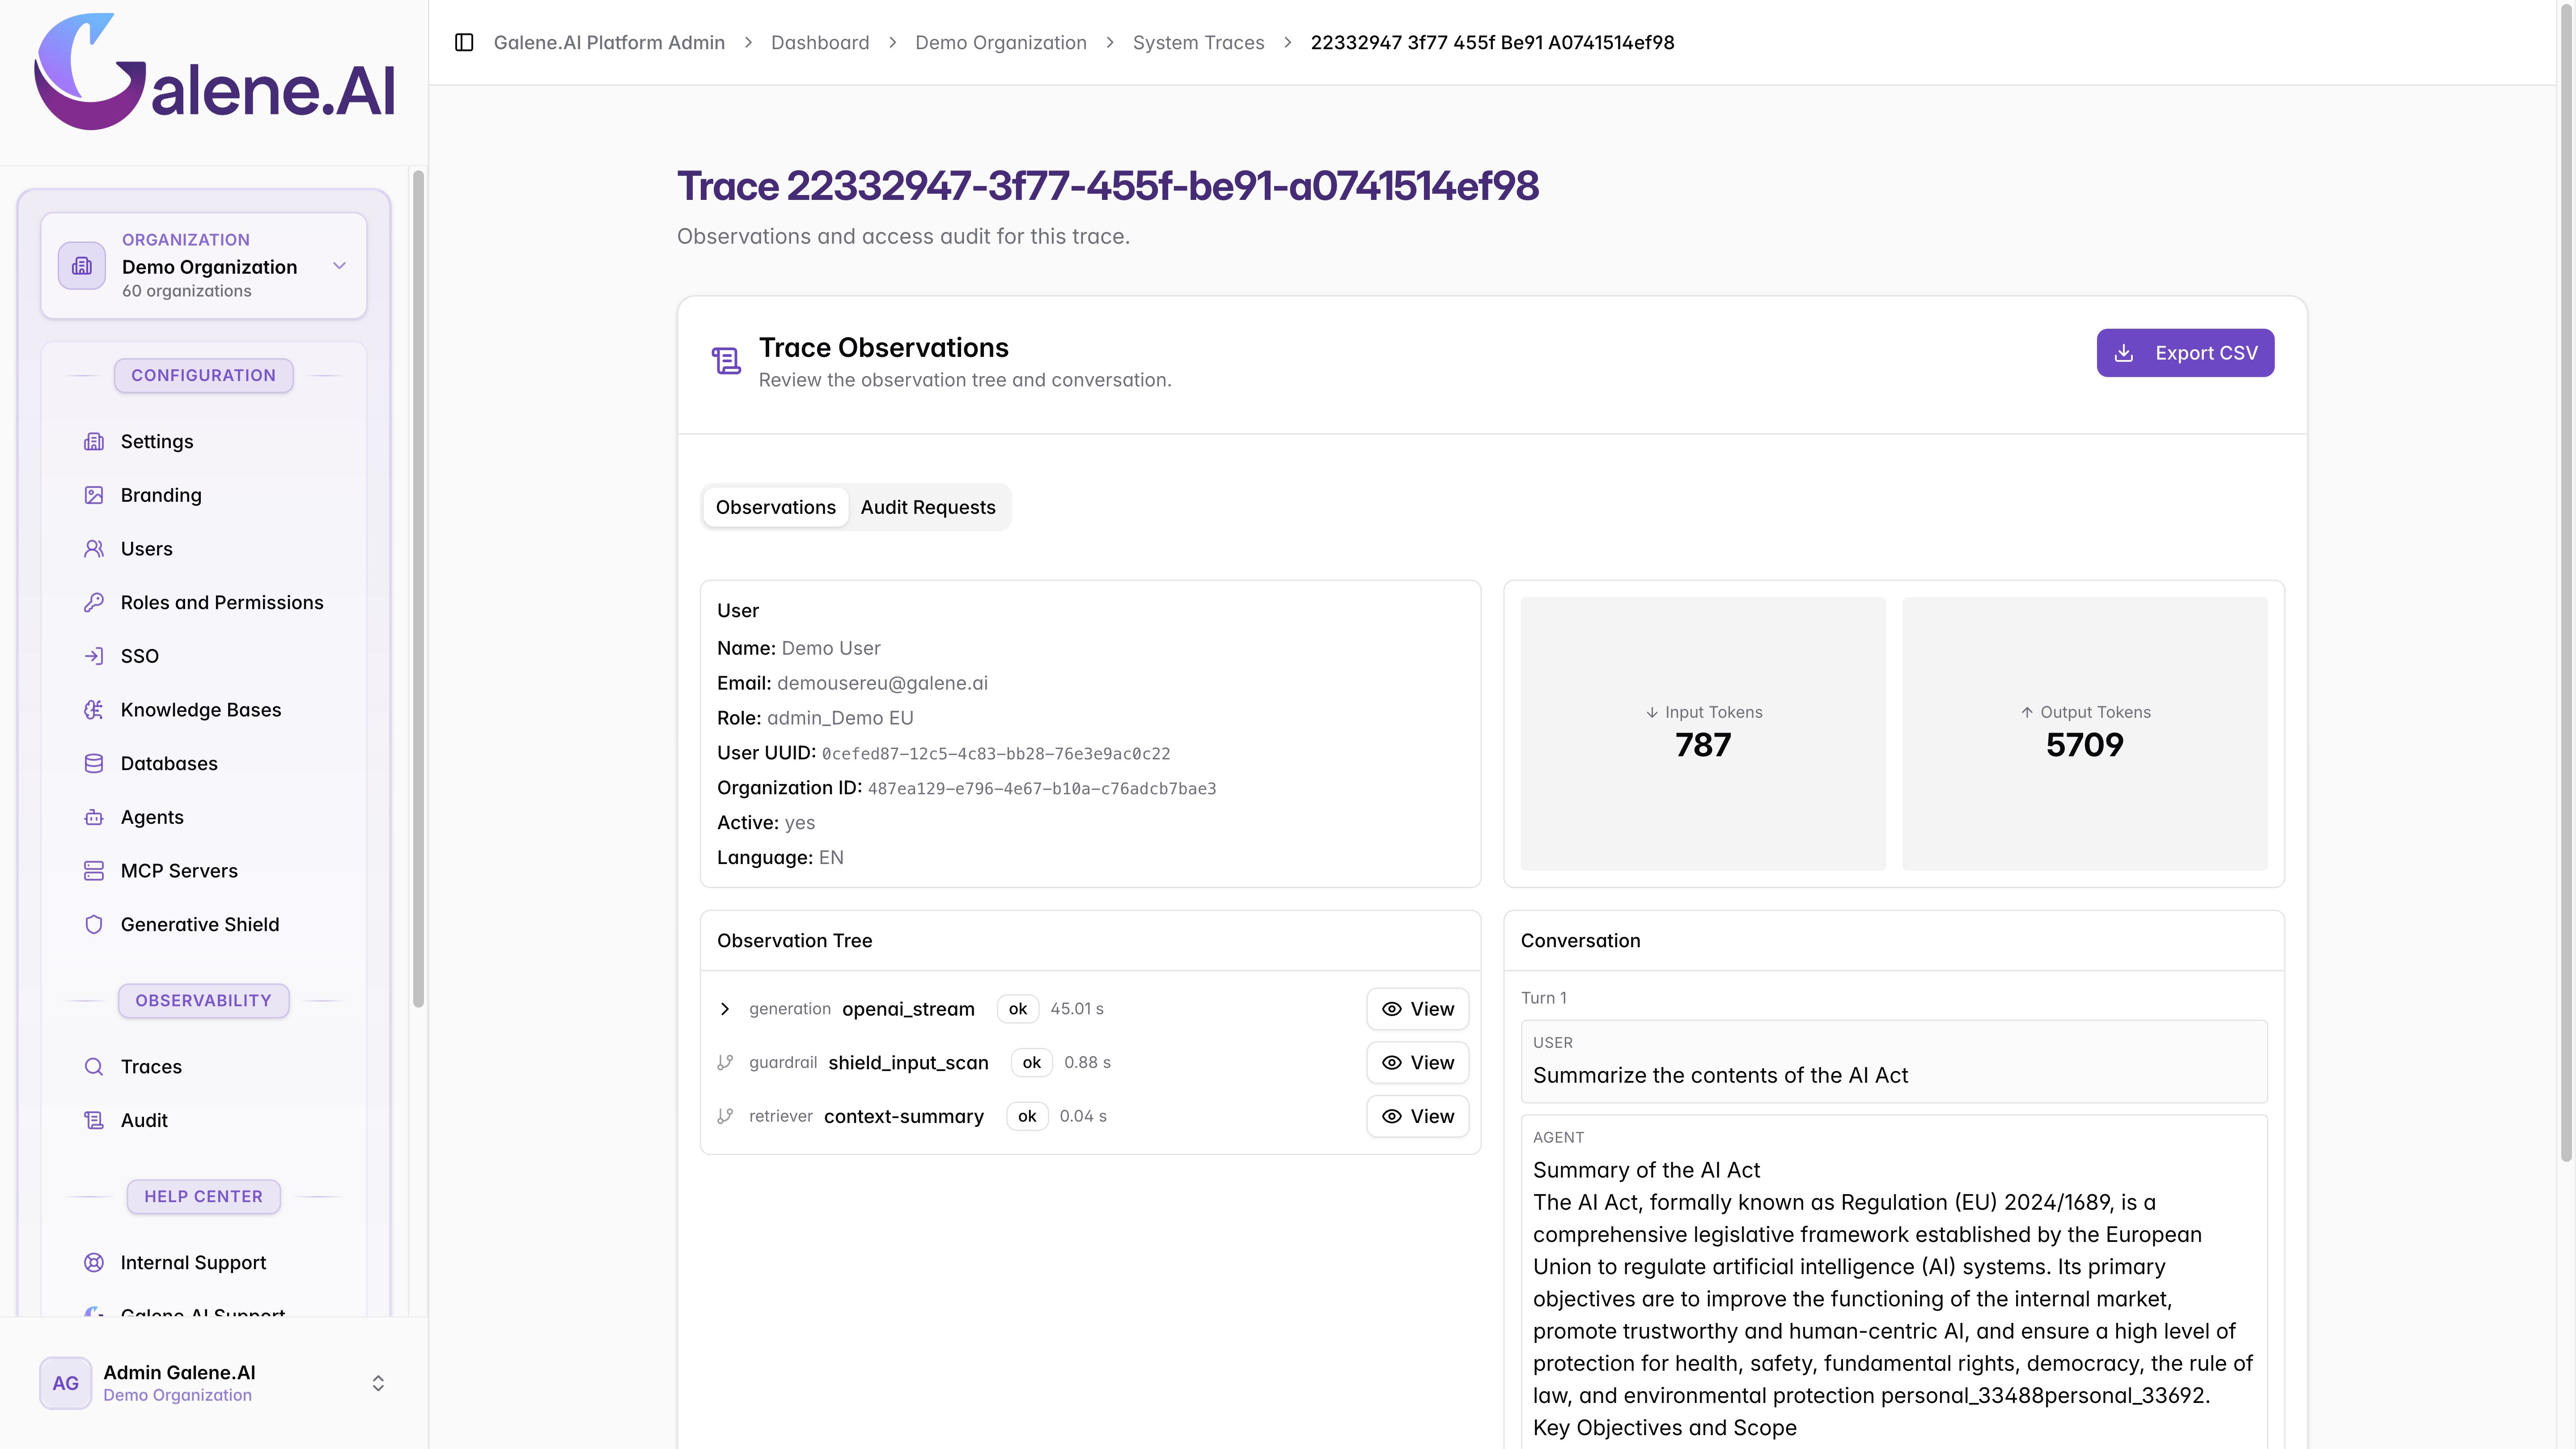
The trace details page displays:
Two Main Tabs
- Observations Tab: Shows user information, token usage, observation tree, and full conversation
- Audit Requests Tab: Logs of who accessed this trace and when (see Audit Documentation)
User Information
Displays the user's name, email, role, User UUID, Organization ID, account status, and language preference.
Token Usage
Shows Input Tokens and Output Tokens to indicate conversation length and complexity.
Token counts indicate the length and complexity of conversations. Unlike cloud-based AI services where tokens determine usage costs, the on-premises deployment means token usage does not directly impact expenses.
Observation Tree
The Observation Tree shows the technical breakdown of how the system processed the conversation in a hierarchical format with collapsible nodes.
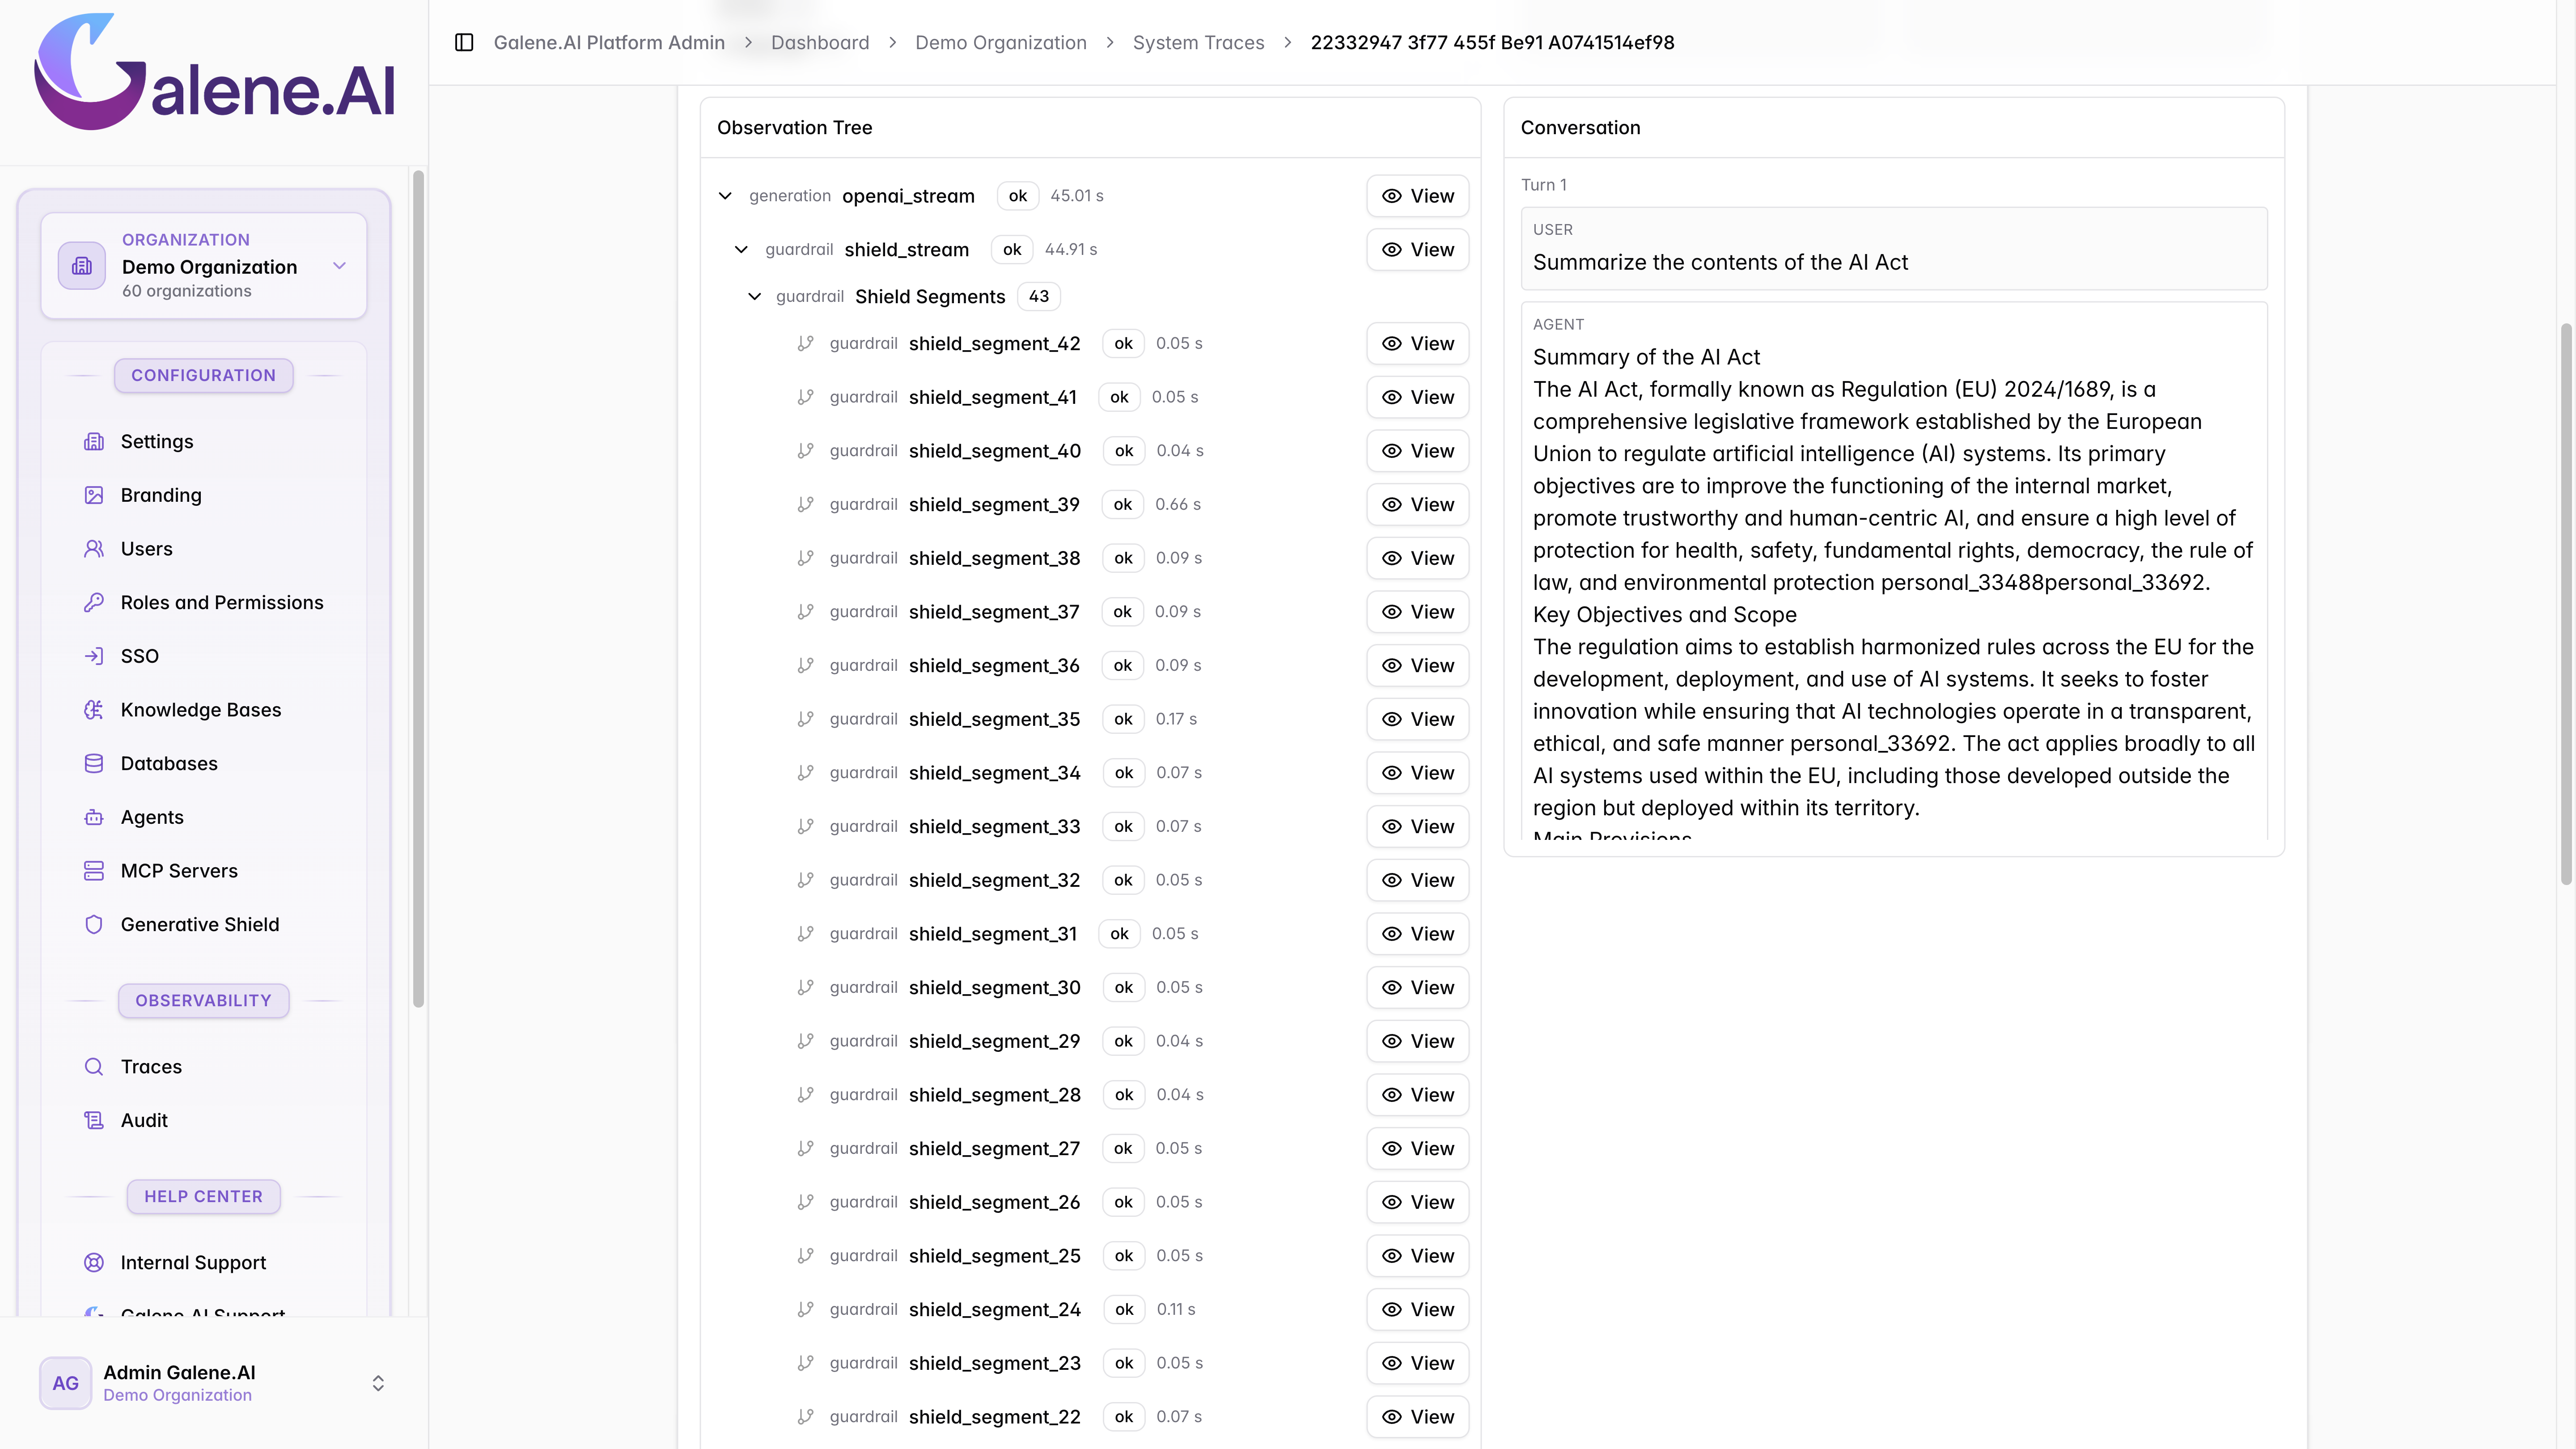
Key Components:
- openai_stream: Main conversation generation process (OpenAI-Compatible streaming)
- shield_stream: Generative Shield's continuous monitoring
- Shield Segments: Individual shield analysis segments (click to view detailed shield analysis)
- shield_input_scan: Shield's pre-check of user input
- context-summary: Context retrieval for the agent's response
Each node shows its status, duration, and a View button for detailed information.
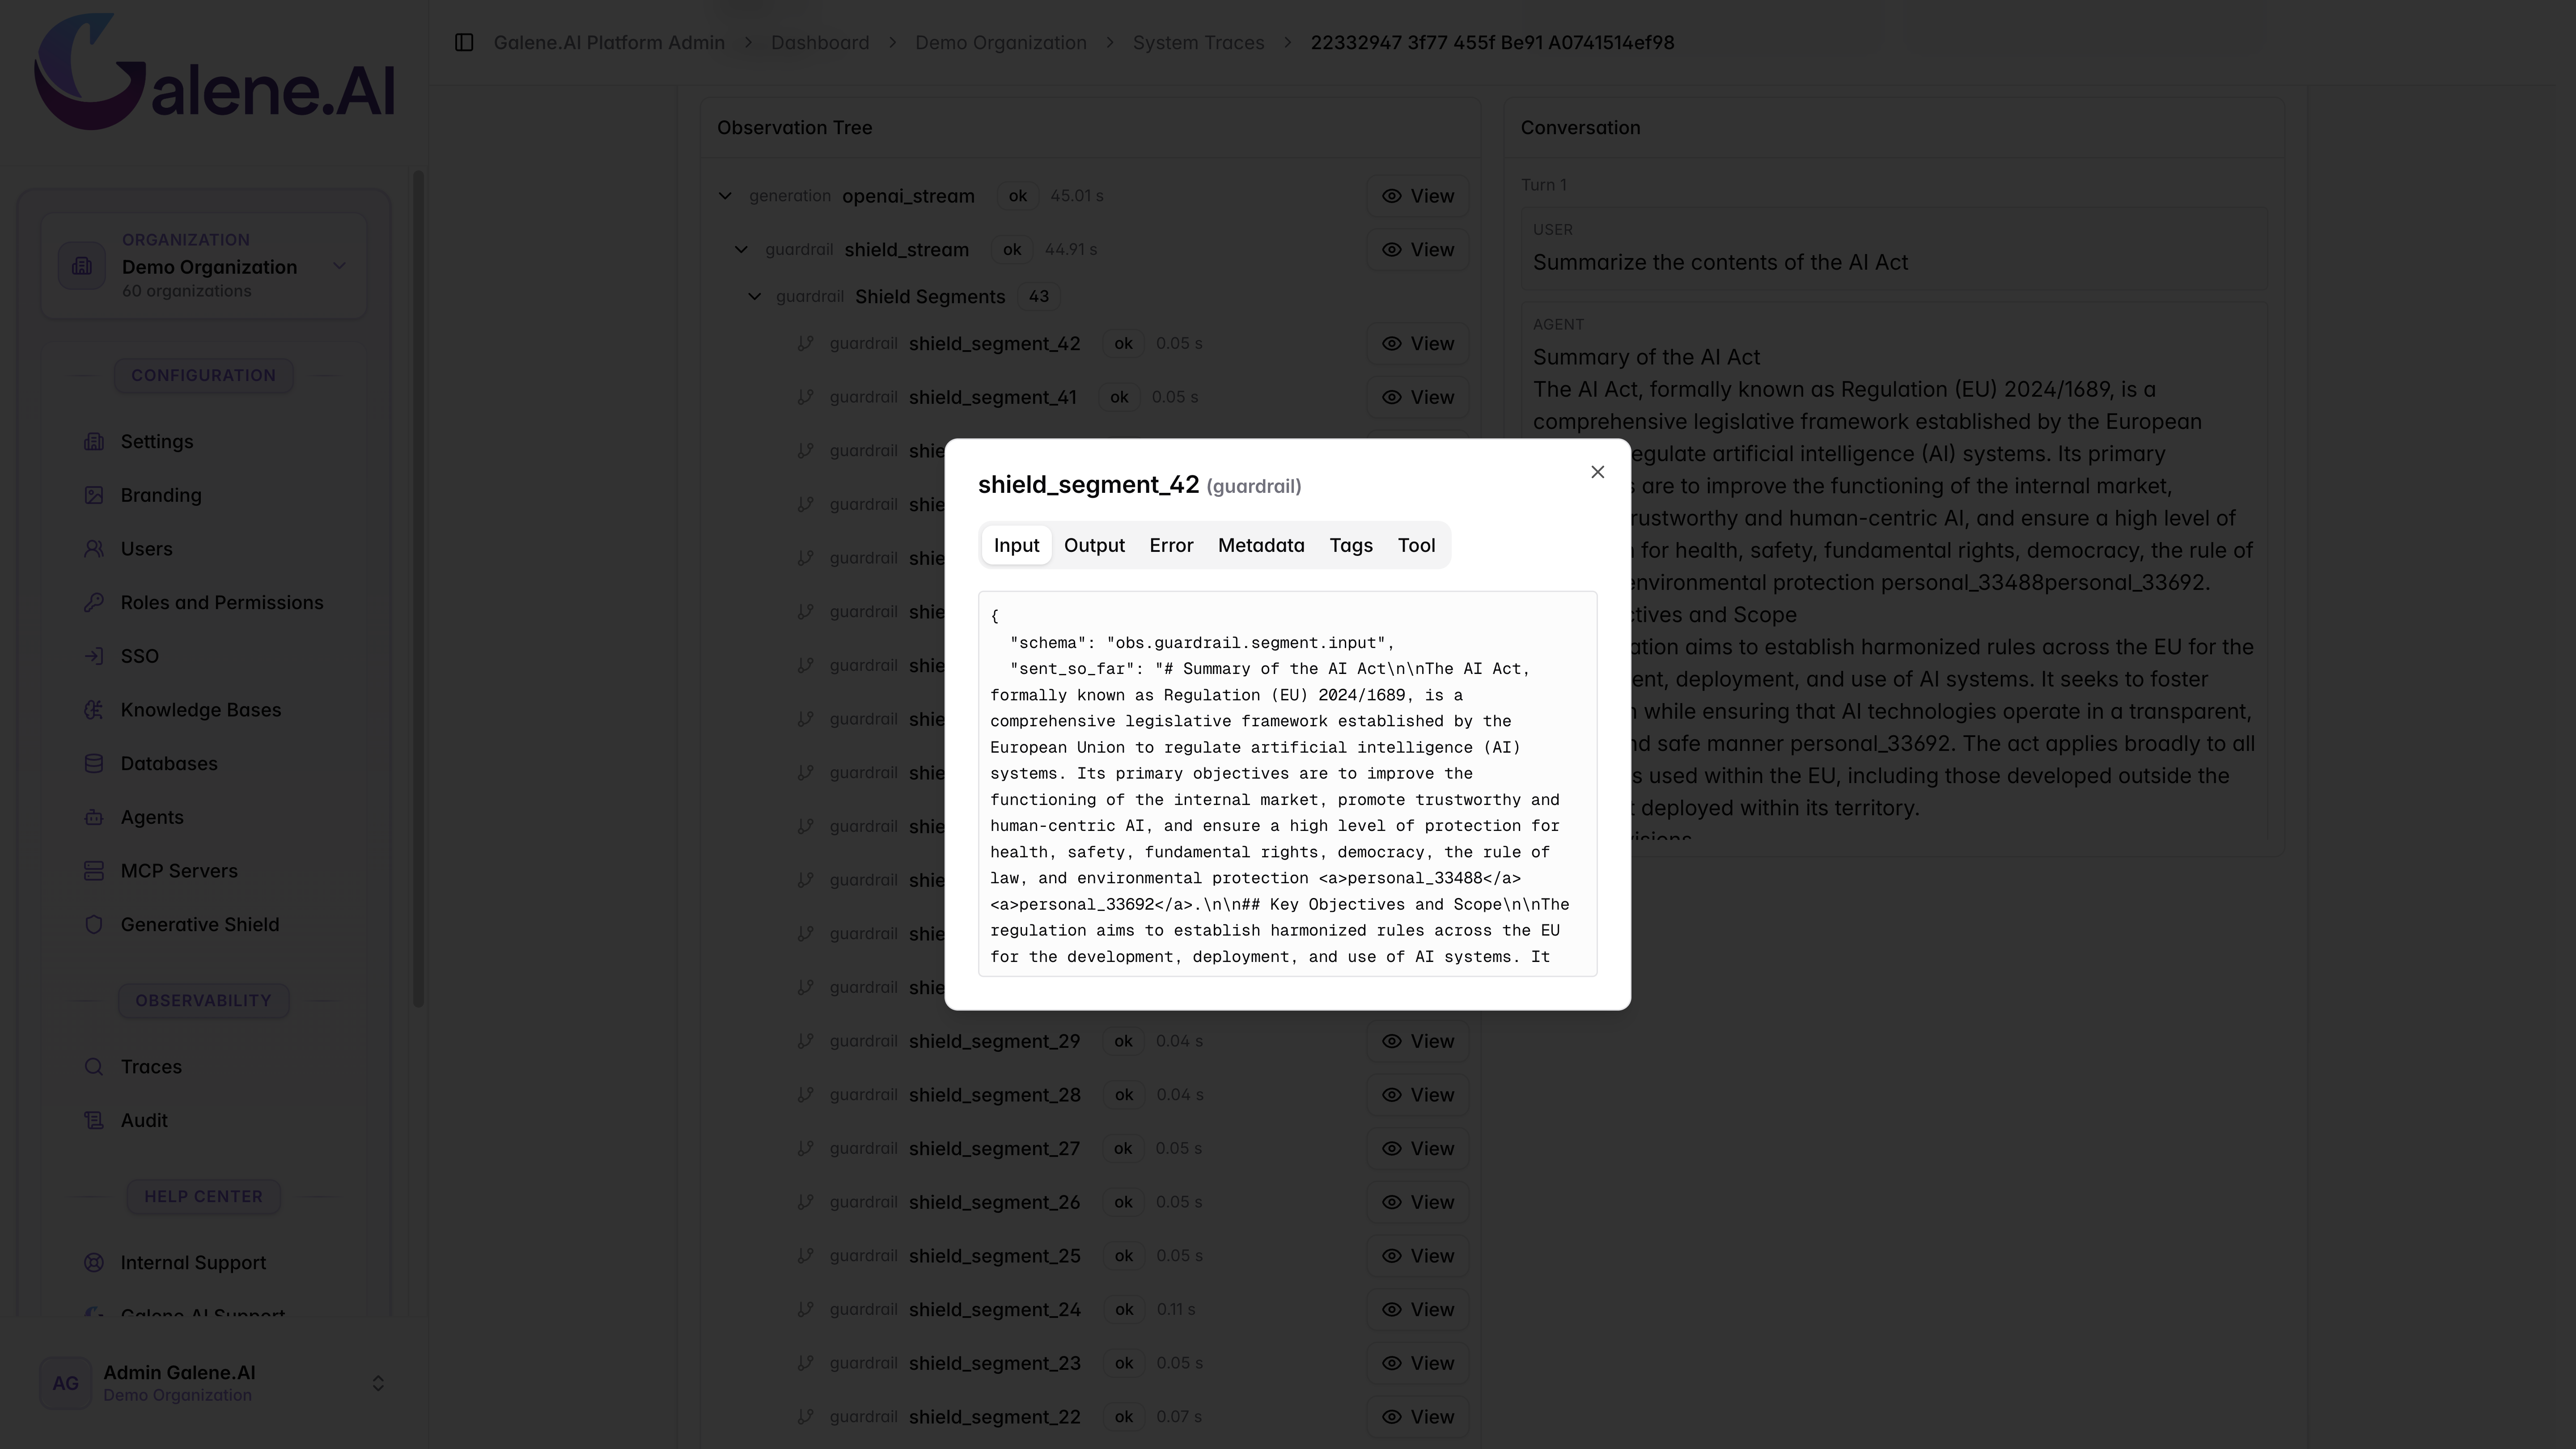
Clicking "View" on a shield segment opens a modal with detailed analysis including Input, Output, Error, Metadata, Tags, and Tool tabs.
Generative Shield monitors all agent interactions in real-time, blocking inappropriate content and ensuring compliance. When you see shield nodes in the observation tree, the safety system actively monitored this conversation.
Learn more: Generative Shield Documentation
Conversation Thread
The conversation section displays the complete exchange between user and agent, with each message clearly labeled. Use this to assess response quality, identify issues, and validate agent behavior.
Review conversations to ensure agents meet quality standards, investigate user complaints, and identify improvement areas.
Exporting Trace Data
Click the "Export CSV" button (top-right corner of the Trace List) to download all visible traces based on your current filters. The export includes all table columns formatted for spreadsheet applications.
Exported trace data contains user information and conversation details. Handle files according to your organization's data protection policies.
Common Issues
- No Traces Showing: Expand the date range or clear all filters
- Empty Conversation: Trace may still be running or was interrupted
Next Steps
- Audit: Track who accessed which traces
- Observability Overview: Complete observability system overview
- Agent Management: Optimize agents based on insights